Top-Down Analysis:
The below maps were analyzed for specific storm-producing characteristics, and conclusions were drawn based on them. The following characteristics were looked for:
250/300 mb Level: Jet stream (blue) & jet Streaks, circulation centers, troughs, and ridges.
500 mb Level: Circulation centers, curvature of the flow, large-scale waves and shortwaves, troughs and ridges, and vorticity (atmospheric spin).
700 mb Level: Circulation centers, troughs, ridges, moisture, and low level jet presence.
850 mb Level: Airmass boundaries, temperature shifts, moisture, and wind shifts.
Surface Level: High pressure centers with clockwise circulation, low pressure centers with counterclockwise circulation, and Frontal Boundaries (e.g., cold
fronts, warm fronts, dry lines).
250 mb Level
300 mb Level
|
500 mb Level
700 mb Level
|
850 mb Level
Surface Level
|
Modeled Data:
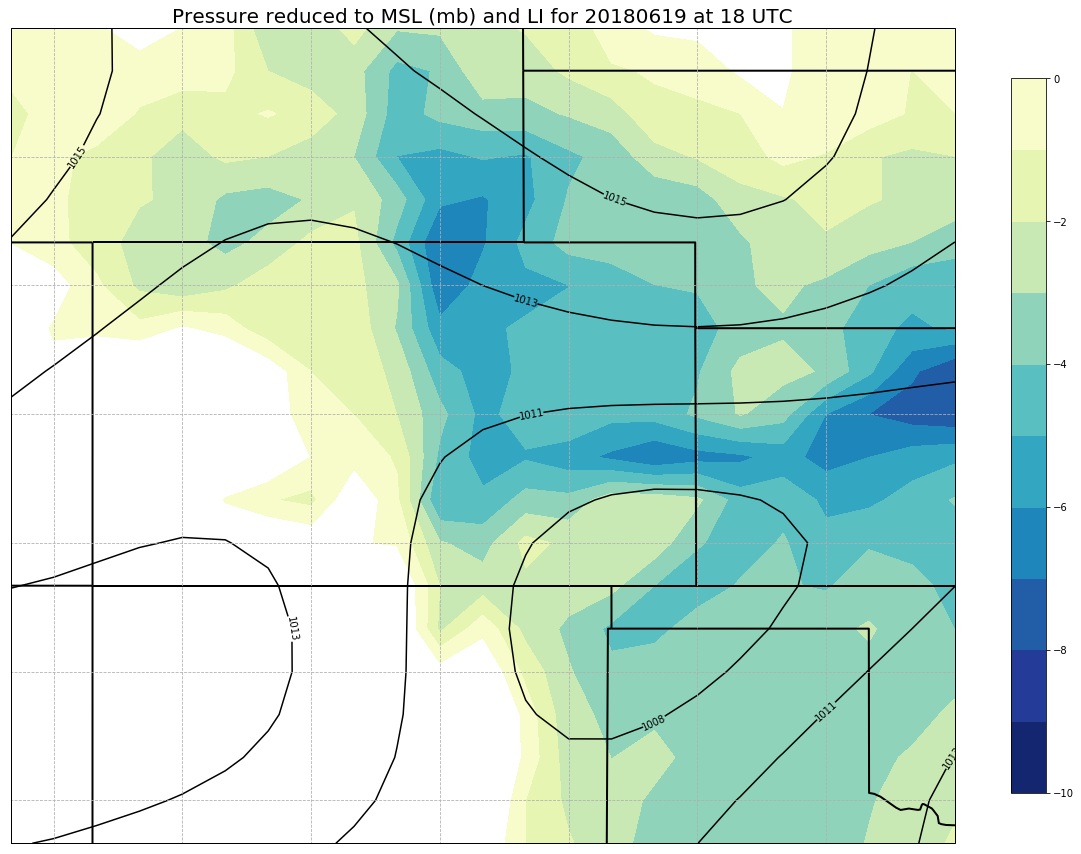
Lifted Index (LI) plotted with Python to visualize instability.
|
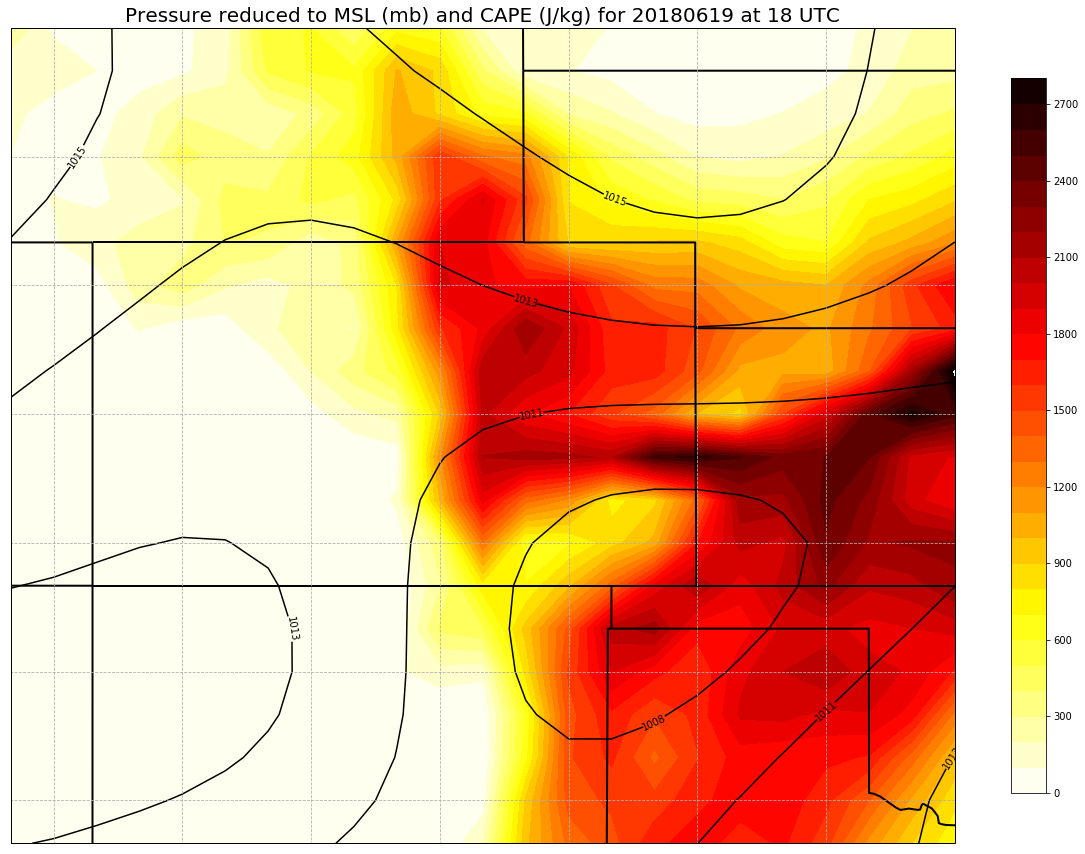
Convective Available Potential Energy (CAPE) plotted with Python to visualize energy.
|
Stuve Diagram used to visualize wind shear.
